Features
Easy to use
Easy to include in any project, easy to read reports.
Open source
We use MIT License. You are welcome to contribute.
Real-time report
You don't need to wait for all tests to finish. Explore results now!
Screenshots
You can take screenshot at any time you want. Useful for UI tests.
Scalable
You can specify different settings to meet requirements of your project.
Very fast
We use JSON.net - the fastest .NET JSON Serializer
Perfect style
We use GitHub Primer and Octicons to make the report nice and clean
Client-side
No server required, you can view report in any browser without running the server.
Data comparer
You can visualize test data and display it in the report.
Test history
Track the history of your test to know it's duration and to see when an error appeared
Test runs history
The history of test runs will help you to easily understand growth of you tests
Hierarchical test list
Easy to understand which subsystem has test failures
Report details
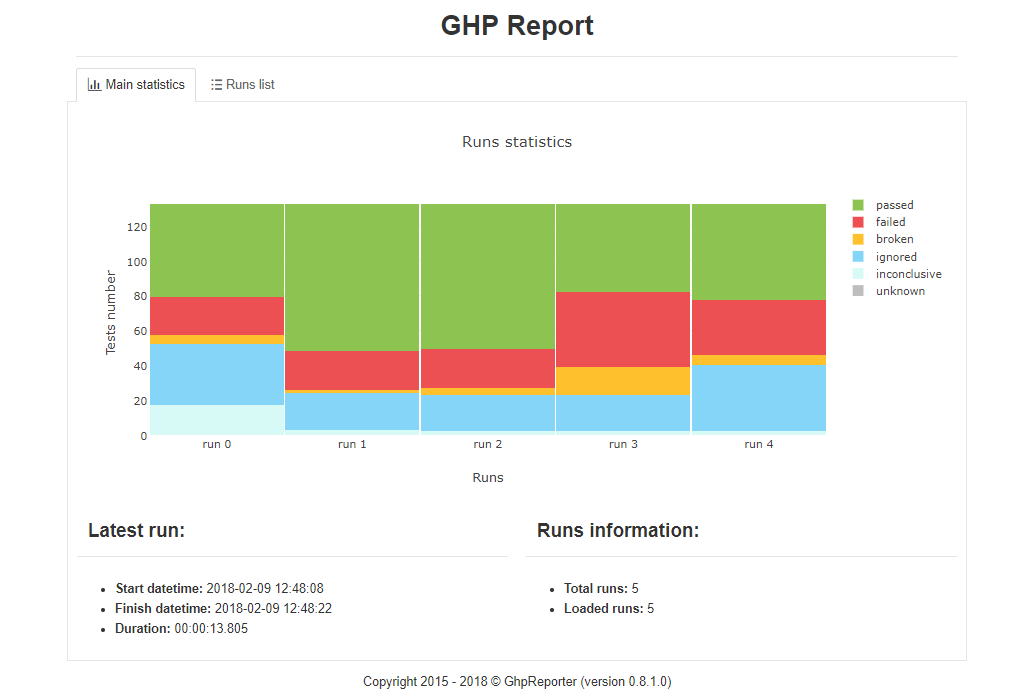
Report main page
Report main page shows overall test runs summary and information about the latest run. You can see number of tests sorted by their result: passed, failed, broken, ignored, inconclusive or unknown. You can also go to "Runs list" tab and open tests run page.
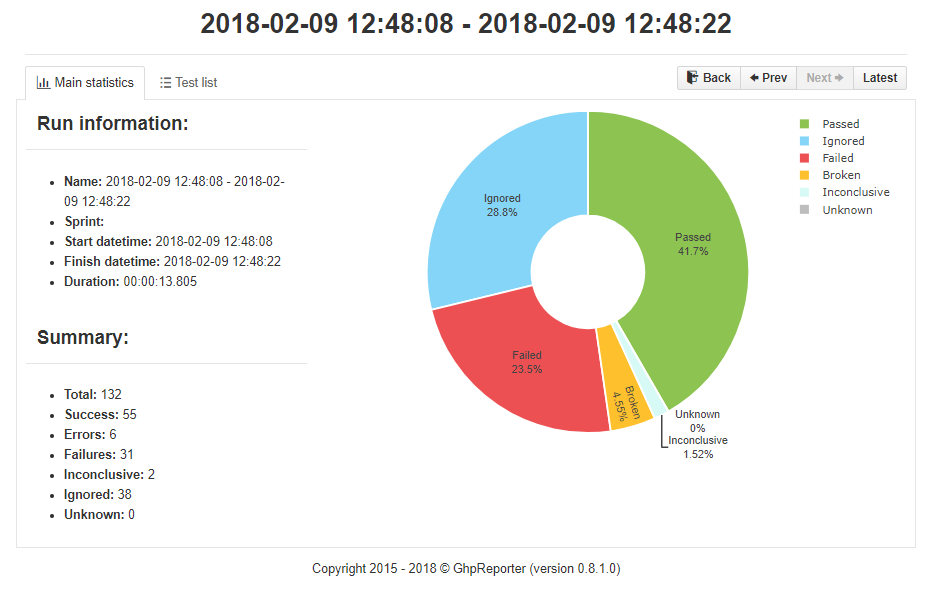
Run page
Run page contains detailed information about one test run. "Main statistics" tab shows start and finish datetime, and short summaary about executed tests. Donut chart shows percentage of each test result categories. "Test list" tab displays all executed tests during current test run. You can choose any test and view detailed information.
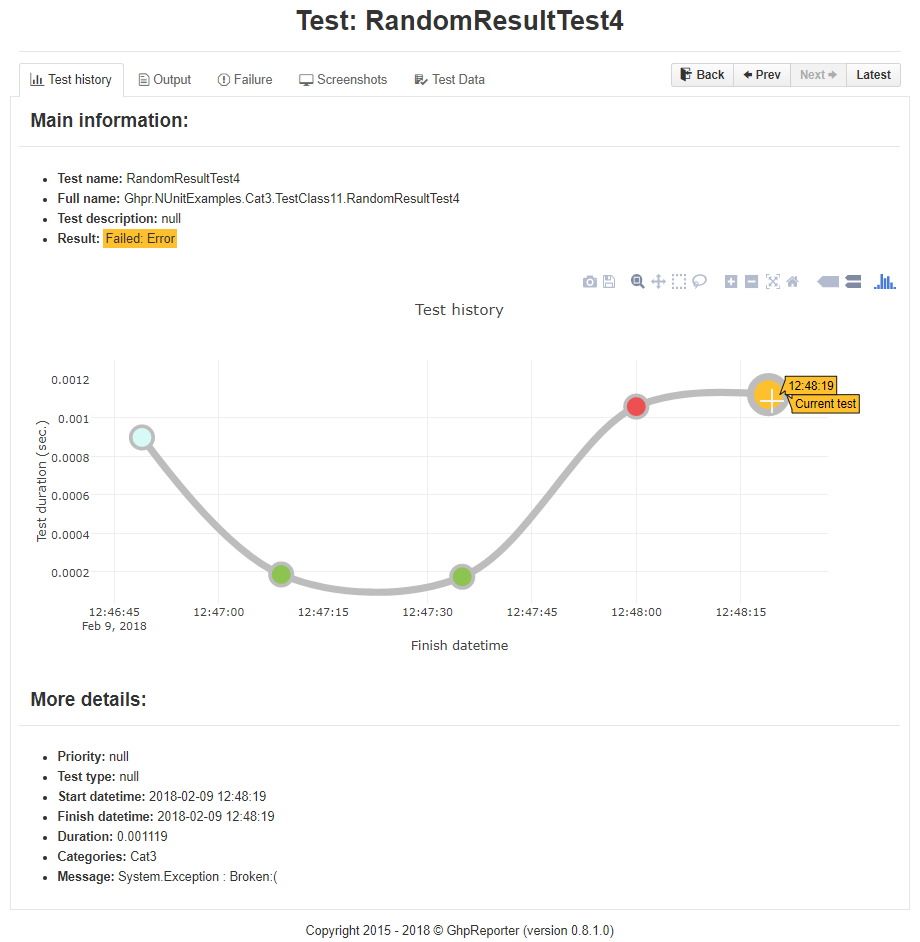
Test result page
This page shows detailed information about current test. "Test history" tab contains history of all test runs. The chart shows test runs duration, each dot color corresponds to test run result, so you can easily find out when your test became broken. "Test output" tab shows current test log.
